


If there is one thing fleet operations are overflowing with, it’s data. Fleet managers are often given the daunting task of turning all that data into informed business decisions, and that’s where our list of the top reports for fleet managers comes in.
Having the right reports that pull key metrics and organize the overwhelming data from your operations is the best tool in your kit for making informed business decisions. Cetaris supports fleet managers with hundreds of available pre-built reports with thousands of configurations in our fleet maintenance software. That’s a lot of data available! According to a recent LinkedIn survey, leading technicians and fleet managers have selected the ability to cut through the noise as a top priority when enhancing their operations. Today, we’re going narrow down a few key fleet management reports from Cetaris that fleet managers swear by. Find which would work best for your team by reading on.
Productivity and Efficiency
The Productivity and Efficiency report looks at technician labor data from a date range of your choosing. This data includes information about an employee’s available hours, direct labor hours, indirect labor, and standard repair hours. Direct hours are repair times billed against an asset and against a work order, while indirect labor hours can be billed against an asset, or a work order, or neither (such as cleaning an asset, rebuilding parts, admin tasks, etc). With this data, the report provides you with two scores per employee: the productivity score and the efficiency score.
The productivity score provides a percentage based on how many available hours the employee was working in the shop between the specified dates. This is determined by adding direct and indirect labor hours together, and dividing the total by the employee’s available hours.
The efficiency score provides a percentage based on an employee’s standard hours divided by their direct hours. You can then take this score and compare it to internal or industry benchmarks to determine whether your shop floor is meeting efficiency goals.
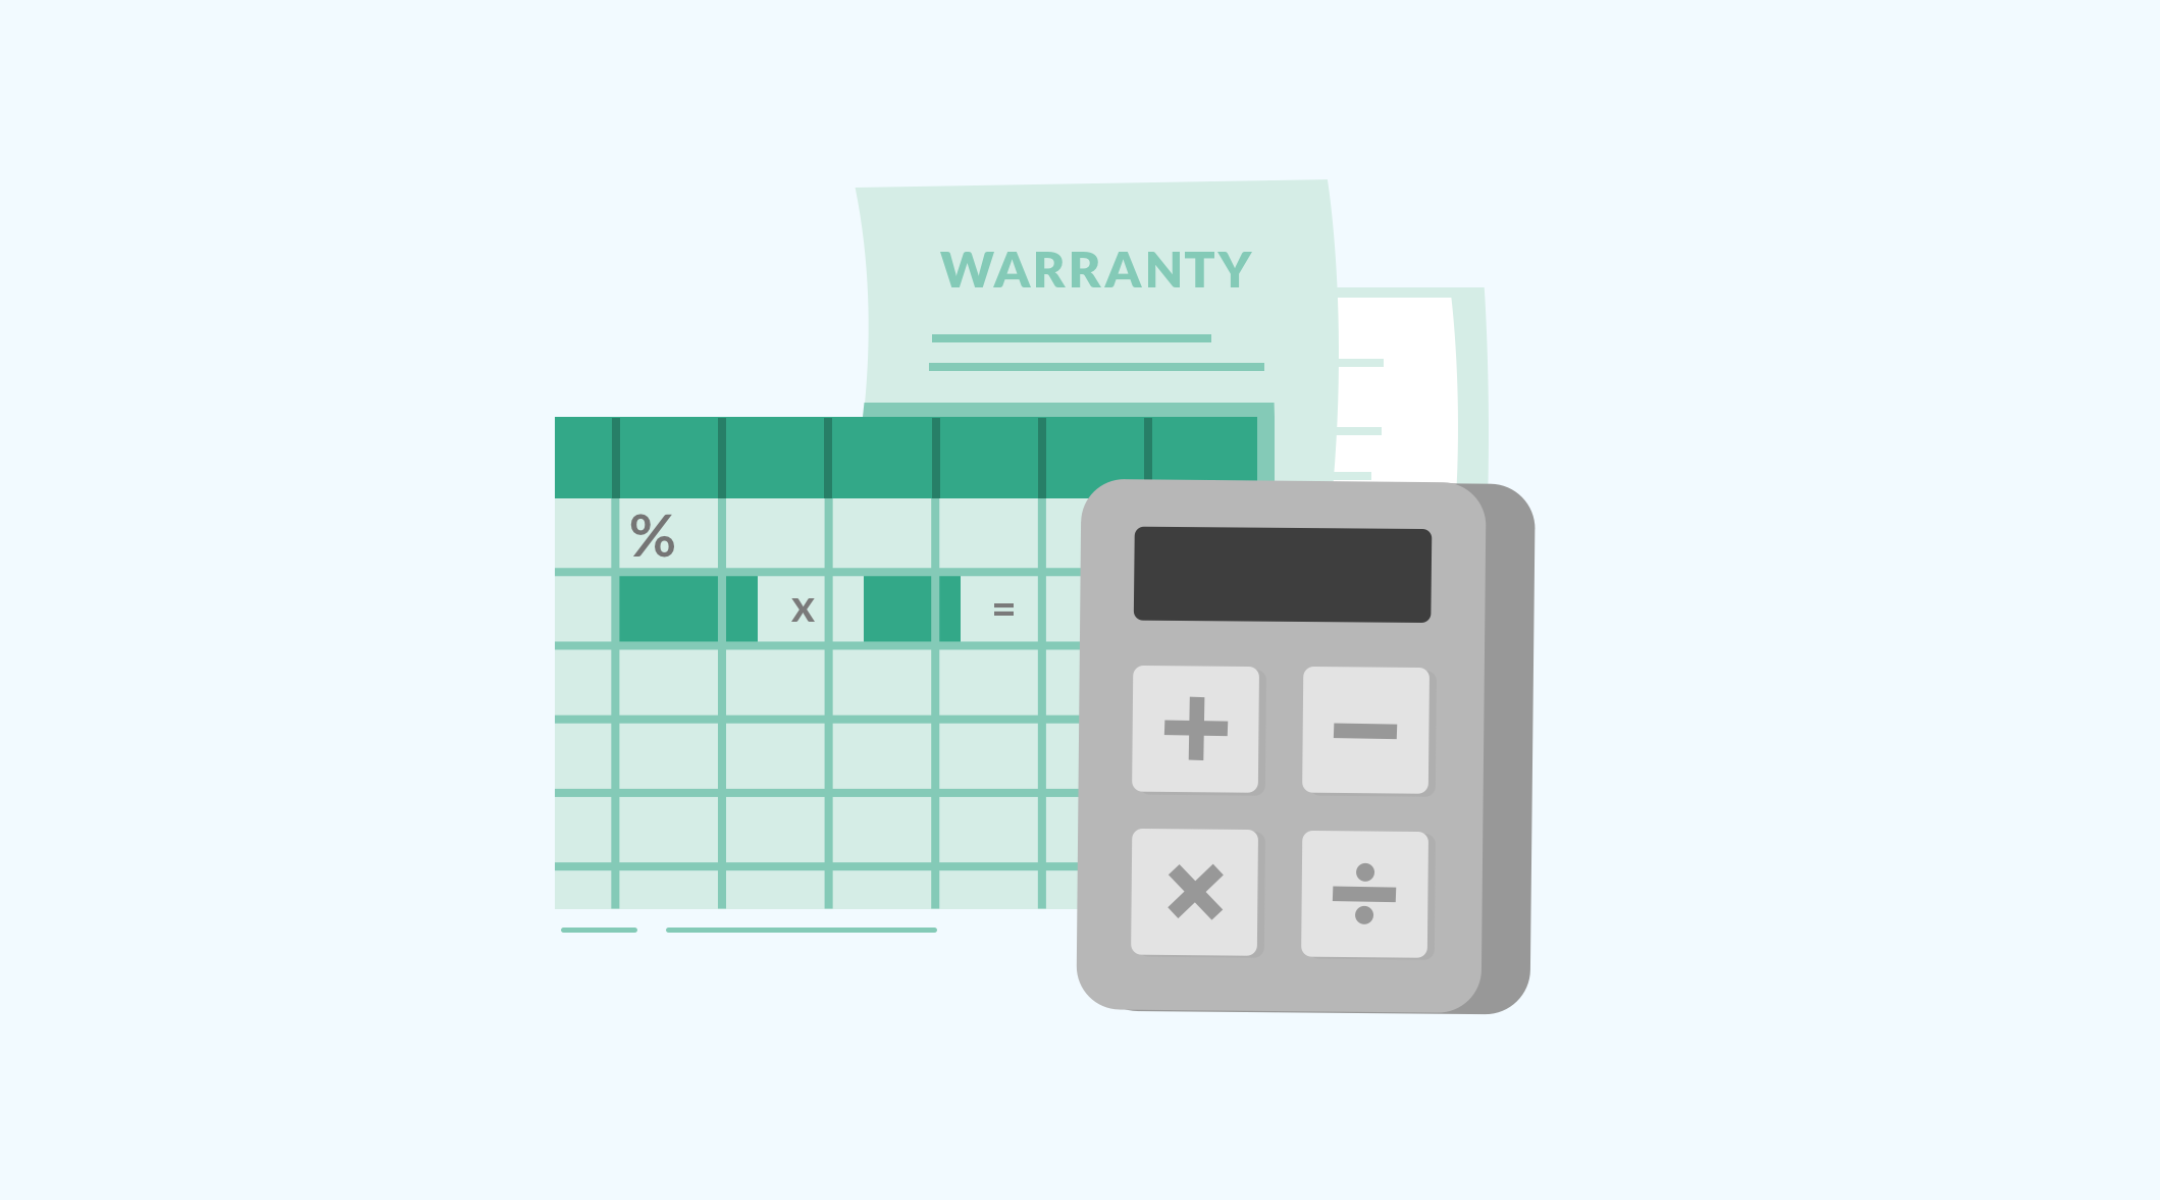
Warranty A/R Aging
If you aren’t using reports for your warranty reimbursement data, you’re likely leaving money on the table. It can be difficult to manage multiple suppliers with different outstanding amounts, and you may be waiting longer than you even realize to get your owed warranty reimbursement. With the Warranty A/R Aging report, you can see all major suppliers and vendors laid out with exactly how much is owed to you in outstanding reimbursement dollars.
You can take this data and track exactly when you need to contact OEM and suppliers in order to ensure you are recouping all of your warranty costs. This can also help you speed up the warranty reimbursement process, ensuring follow ups happen sooner and you aren’t missing opportunities.
Work Order Detail
The Work Order Detail report offers an overview of a specific work order, giving you an outline of all of the details involved. The report drills down into a full look at the cost of each work order, giving you insight into exactly what happened and an accurate cost of the work order.
Included in the report is the description of the asset, the reason for the repair, what the technician did and in what timeline, the parts used, and any additional repairs associated with that work order.
Work Order Summary by System Code
The most important reports in a fleet manager’s arsenal are the reports that look at failures across fleets. Having insight into failures and repairs enables you to make critical decisions about your assets, and your fleet as a whole.
The first report that looks at repairs is the Work Order Summary by System Code. This report gives you a look at what assets are driving costs compared to the rest of your assets. With this report, you can see exactly where those costs are going – from the air conditioning to brakes to tires, etc.
Work Order Summary by Reason for Repair
The second report that looks at repairs is the WO Summary by Reason for Repair. With this report, you can look at the dollar value based on work order repair lines for specific assets.
You can pull an asset that has a high repair rate to dig into the details and see where that overspending is happening. The data enables you to drill down into the impact a specific asset might be having on your entire fleet.
Both Work Order Summary reports can be used to help identify problem assets and parts that are bloating repair costs. They can also be used to visualize repair time overages to identify training and skill gaps for technicians. Overall, these reports are used to help you to make informed decisions to streamline costs and reduce failures in the future.
Slow Moving Parts
Your parts room could be a major culprit for tied up cash, filled with stock that your shop rarely needs to use. This is where the Slow Moving Parts report comes in. You can run the report and get a full list of parts that are slow moving (you determine what that means for your business), and see which parts you’re keeping on hand that you don’t need.
This will give you an idea of where you can free up some investment and ensure that you aren’t holding on to parts that you don’t need in favor of parts that you require more regularly.
How Cetaris can help you
All of these pre-built reports are available in our fleet maintenance management software. Ready to see up close how Cetaris can optimize your maintenance department? Click below to get in touch with our sales team and book a demo. 👇
